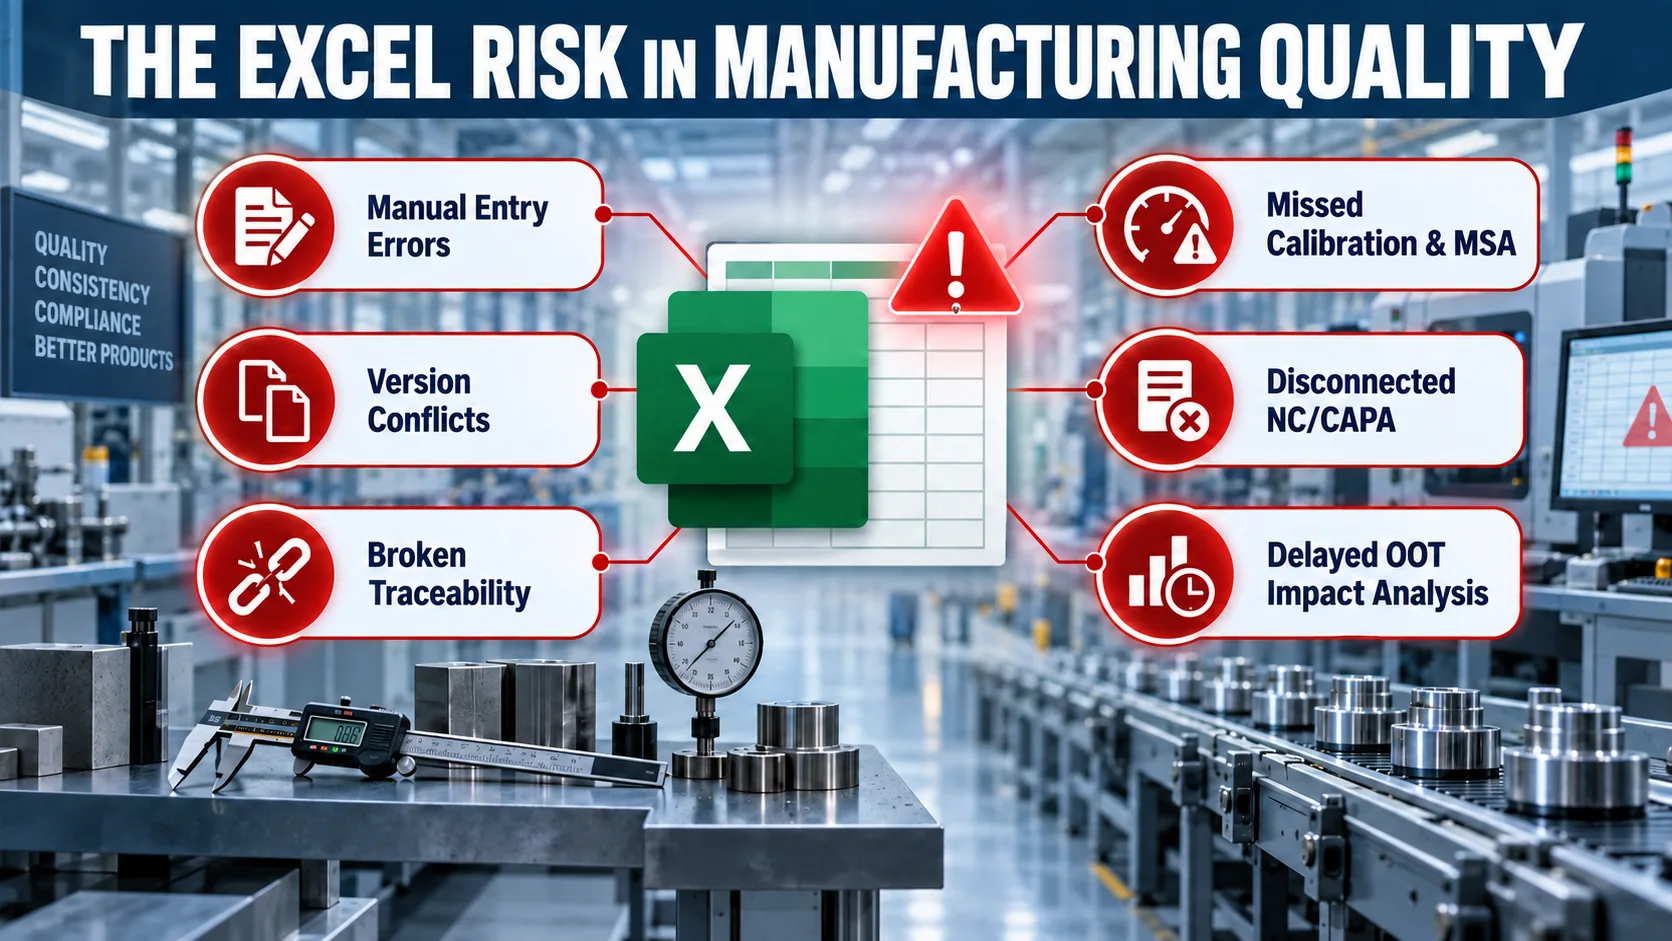
Consider a manufacturer managing gauges in Excel. It may be an MSME with 100 gauges or an industry leader with thousands distributed across plants, laboratories, production lines and suppliers. The registers appear complete: identification numbers, locations, calibration dates, due dates, statuses and certificate references are present. Formulas calculate due dates, colours highlight overdue items and summary tabs report compliance. The spreadsheets look organised, inexpensive and familiar.
Then a gauge is found out of tolerance. The quality team must determine when it began to drift, where it was used, which CTQs it measured, which batches were accepted and whether affected product reached the customer. Excel rarely establishes those relationships on its own — it depends on people having manually captured every link, in every file, at the correct time and without error. The register contains only the latest location; inspection records do not identify the gauge used; evidence sits in separate folders; and different users may hold different versions.
The case exposes the real problem: Excel can maintain a gauge list, but it cannot reliably govern the manufacturing actions and evidence that must follow each status change. The gauges may be good; the spreadsheet-driven control model may still produce unsafe quality decisions.
Why Excel Creates False Confidence
Excel is effective for analysis and data exchange. It becomes risky when it is treated as the primary control system for calibration, MSA, gauge status, approvals, traceability, NC/CAPA and product-impact decisions. A cell stores a value; it does not understand whether the value is technically valid, properly approved or consistent with what happened on the factory floor.
The exposure exists even with 100 gauges. Risk is determined by measurement criticality and consequence, not row count. One wrong due date, overwritten formula, mismatched certificate or incorrect Active status can allow a suspect gauge to support thousands of product-acceptance decisions.
The apparent simplicity of Excel also hides operational complexity. Each gauge generates calibration events, certificate revisions, MSA studies, location changes, repairs, quarantines and approvals. When those events are distributed across worksheets, folders and user-maintained copies, control depends on perfect manual reconciliation. That is not a sustainable quality safeguard.
This Is Not Only an MSME Problem
Large manufacturers also continue to manage gauges through Excel. The practice often survives because it grew locally: one plant created a register, another added macros, a third built its own dashboard, and suppliers submitted separate templates. Each file may work adequately for its owner, but the enterprise has no single governed record of gauge status, evidence and risk.
Scale does not make Excel safer; it multiplies the consequences of its weaknesses. Thousands of gauges create recurring calibration events, MSA studies, transfers, repairs, certificate revisions and exceptions. Multiple plants introduce different naming conventions, formulas and approval practices. Shared drives, email attachments and downloaded copies create parallel versions. When a critical event occurs, corporate quality must reconcile local files before it can understand enterprise exposure.
An industry leader may therefore have sophisticated production systems while its measurement controls still depend on spreadsheets maintained by individual plants or employees. Management may see consolidated compliance percentages without being able to drill down to the evidence, approval history and product decisions behind them. The issue is not organisational maturity; it is the architectural mismatch between a spreadsheet and an enterprise control process.
- Cross-plant inconsistency in gauge IDs, statuses, calibration rules and MSA methods
- Key-person dependency when macros, formulas and exceptions are understood by only one employee
- Supplier evidence received in incompatible formats and reconciled manually
- Delayed enterprise visibility when plant-level files are consolidated periodically
- Weak segregation of duties when file access also permits status and formula changes
- Audit reconstruction across plants, laboratories and product programmes becoming a manual exercise
The Excel Dashboard That Shows 100 Percent and Proves Nothing
A well-maintained Excel workbook may use formulas, conditional formatting and a summary tab to report 100% of gauges calibrated, no overdue items and all actions closed. The Excel dashboard looks reassuring, but it reports only the values currently entered in its cells. It does not prove that the required controls were executed on the factory floor.
| The Excel dashboard reports |
What Excel does not control |
| 100% calibrated |
Is the correct certificate linked to this exact gauge? |
| No overdue gauges |
Was an expired or failed gauge physically prevented from being used? |
| Gauge status Active |
Was calibration reviewed and approved before release to production? |
| MSA completed |
Is the study valid for the assigned gauge, CTQ, operator and process? |
| No open NCs |
Did the out-of-tolerance result trigger containment and product-impact assessment? |
| CAPA closed |
Was effectiveness verified, or was a cell simply changed to Closed? |
Every statement in the left column is a value reported by the Excel summary. Every question in the right column is a control obligation outside the spreadsheet. Excel can calculate a percentage, but on its own it does not enforce the process that makes the percentage trustworthy.
The issue is not dashboards themselves. A dashboard backed by governed records, enforced workflows and connected evidence can provide assurance. The risk is treating an Excel summary tab as proof of control when its source data and status changes remain manually maintained.
In Excel, a user can change a gauge from Failed to Active, extend a due date, replace a certificate or close a CAPA without proving that the required actions occurred. If an incorrect certificate, unsuitable gauge, incomplete MSA or unresolved product impact can coexist with a green Excel dashboard, it is measuring spreadsheet completeness — not manufacturing control.
An Out-of-Tolerance Event Exposes the Gap
A failed gauge may be repaired, recertified and marked Active. The row returns to green, but the real investigation must establish the suspected drift window and connect the gauge to its place of use, CTQs, inspection results, lots, batches and conformity decisions. It must also initiate containment, determine product impact, open the required NC/CAPA, assign ownership and verify effectiveness before authorised return to service.
When these relationships are spread across spreadsheets, certificate folders, control plans and inspection reports, impact analysis becomes a manual reconstruction. Delays can widen the containment window, hold unaffected product, miss affected lots, weaken root-cause analysis and postpone customer notification.
The spreadsheet may show one failure and one closure. The actual risk may extend across production lines, batches and customers. The spreadsheet is resolved; the risk is not.
The Risks Excel Leaves Uncontrolled
The weakness is structural, not cosmetic. More colours, formulas and protected cells may improve the file, but they do not remove the following risks:
- Manual data error — wrong dates, ranges, locations, statuses or certificate references can appear valid
- Version conflict — emailed, downloaded or locally saved copies can become competing sources of truth
- Formula failure — formulas can be overwritten, ranges can omit new rows and filters can hide exceptions
- Weak approval control — a user can change Failed to Active without enforced review or release evidence
- Broken traceability — calibration, MSA, laboratory scope, CTQs and inspection records remain disconnected
- Disconnected NC/CAPA — failures may be closed administratively without containment or effectiveness checks
- No impact propagation — an out-of-tolerance result does not automatically identify affected parts, lots or customers
Why Better Spreadsheet Discipline Is Not Enough
Protected cells, controlled folders, macros and cloud version history can improve an Excel-based process. They may reduce accidental edits, preserve file versions and automate reminders. But these are still file-level safeguards. They do not automatically require certificate approval before release, block a failed gauge from production, initiate an NC, verify CAPA effectiveness or connect an out-of-tolerance event to affected inspection results and batches.
As an enterprise workbook becomes more sophisticated, it also creates a validation and ownership burden. Critical logic may be hidden in formulas, named ranges, macros and linked files understood by only a few people. A seemingly minor change can alter calculations or omit records without creating a visible process exception. The organisation must then audit not only the gauge data but also the spreadsheet logic controlling the reported result.
Excel remains valuable for analysis, calculation and data exchange. It is not designed to be the system of record and enforcement layer for gauge governance. Adding worksheets, macros, hyperlinks, colours and manual reviews can make the file more sophisticated, but it also creates more dependencies, more maintenance and more opportunities for silent failure.
For an MSME, the exposure may be concentrated in one register and one production facility. For an industry leader, the same weakness can spread across plants, suppliers, laboratories and product programmes. In both cases, the control requirement is the same: gauge status must be supported by connected evidence, authorised transitions and traceability to the manufacturing decisions it affects.
A calibration dashboard showing 100% does not prove that every measurement decision was valid. Without a way to prove the evidence, approval, physical control and downstream product impact behind each status, 100% is not assurance. It is simply a number with a green background.